Say you have money to put into crypto. You can invest all of it at once, a lump sum, or split it into equal amounts and buy on a schedule, say every week, whatever the price. The second way is called dollar-cost averaging, or DCA.
Should you put everything in at once, or buy a little every week? Most backtests answer with bitcoin alone, and with a price source that only lists coins that are still trading. We used Binance's public data archive, which keeps the coins Binance delisted, and asked two questions:
- For bitcoin and ether, which method won from every possible start date since August 2017?
- If you had bought the top 10 coins every January from 2018 to 2025, what mattered more: how you bought, or what?
- The coin mattered far more than the method. $1 put into each of January 2018's top 10 is worth between $0.01 (IOTA) and $5.18 (bitcoin) today, a 392× spread. Buying weekly instead changed any single coin's result by 2.4× to 9.2×.
- None of January 2018's top 10 beat simply holding bitcoin, and 7 of the 10 are worth less than they cost. Across eight Januaries, the top 10 as a basket beat bitcoin twice (2020 and 2021), both times thanks to BNB.
- For bitcoin itself, the lump sum usually won: over 3 years it beat weekly buying on 70% of 2,240 start dates (ether: 65%). Over 5 years: 85% for bitcoin, 73% for ether.
- Weekly buying earns its keep on the worst days to start. $1 of bitcoin bought on 16 December 2017, its highest close of that cycle, was worth $0.17 a year later. Spread over 52 weeks from the same day, it was worth $0.43.
My takeaway: bitcoin looks like the safer bet compared with altcoins. Some of them did better from certain years, BNB most of all, but over the longest stretches we tested, from January 2018 and 2019, none of the top 10 beat it.
$1 in January's top 10, held to 30 September 2026
| January | Top 10, lump sum | Top 10, weekly buys | Bitcoin alone, lump sum | Coins that beat bitcoin |
|---|---|---|---|---|
| 2018 | $1.08 | $4.04 | $5.18 | none of 9 |
| 2019 | $6.89 | $6.17 | $20.97 | none of 9 |
| 2020 | $11.53 | $8.06 | $11.36 | 2 of 8 (ETH, BNB) |
| 2021 | $3.78 | $1.18 | $2.53 | 3 of 8 (ETH, XRP, BNB) |
| 2022 | $0.72 | $1.63 | $1.77 | none of 9 |
| 2023 | $2.47 | $1.83 | $5.03 | 1 of 9 (TRX) |
| 2024 | $1.52 | $1.12 | $1.90 | 3 of 9 (BNB, XRP, TRX) |
| 2025 | $0.61 | $0.72 | $0.85 | 2 of 9 (BNB, TRX) |
The top 10 is an equal-weight basket: $1 split evenly across the coins. "Weekly buys" means the same $1 spread over 52 weekly buys, then held. 2020 and 2021 have 9 coins because one of the top 10 (Bitcoin SV) had already left Binance.
The coin mattered more than the method
Here is what $1 in each of January 2018's top 10 became, bought on 7 January 2018 (NEM from 20 March 2018, where its Binance data starts) and held to 30 September 2026:
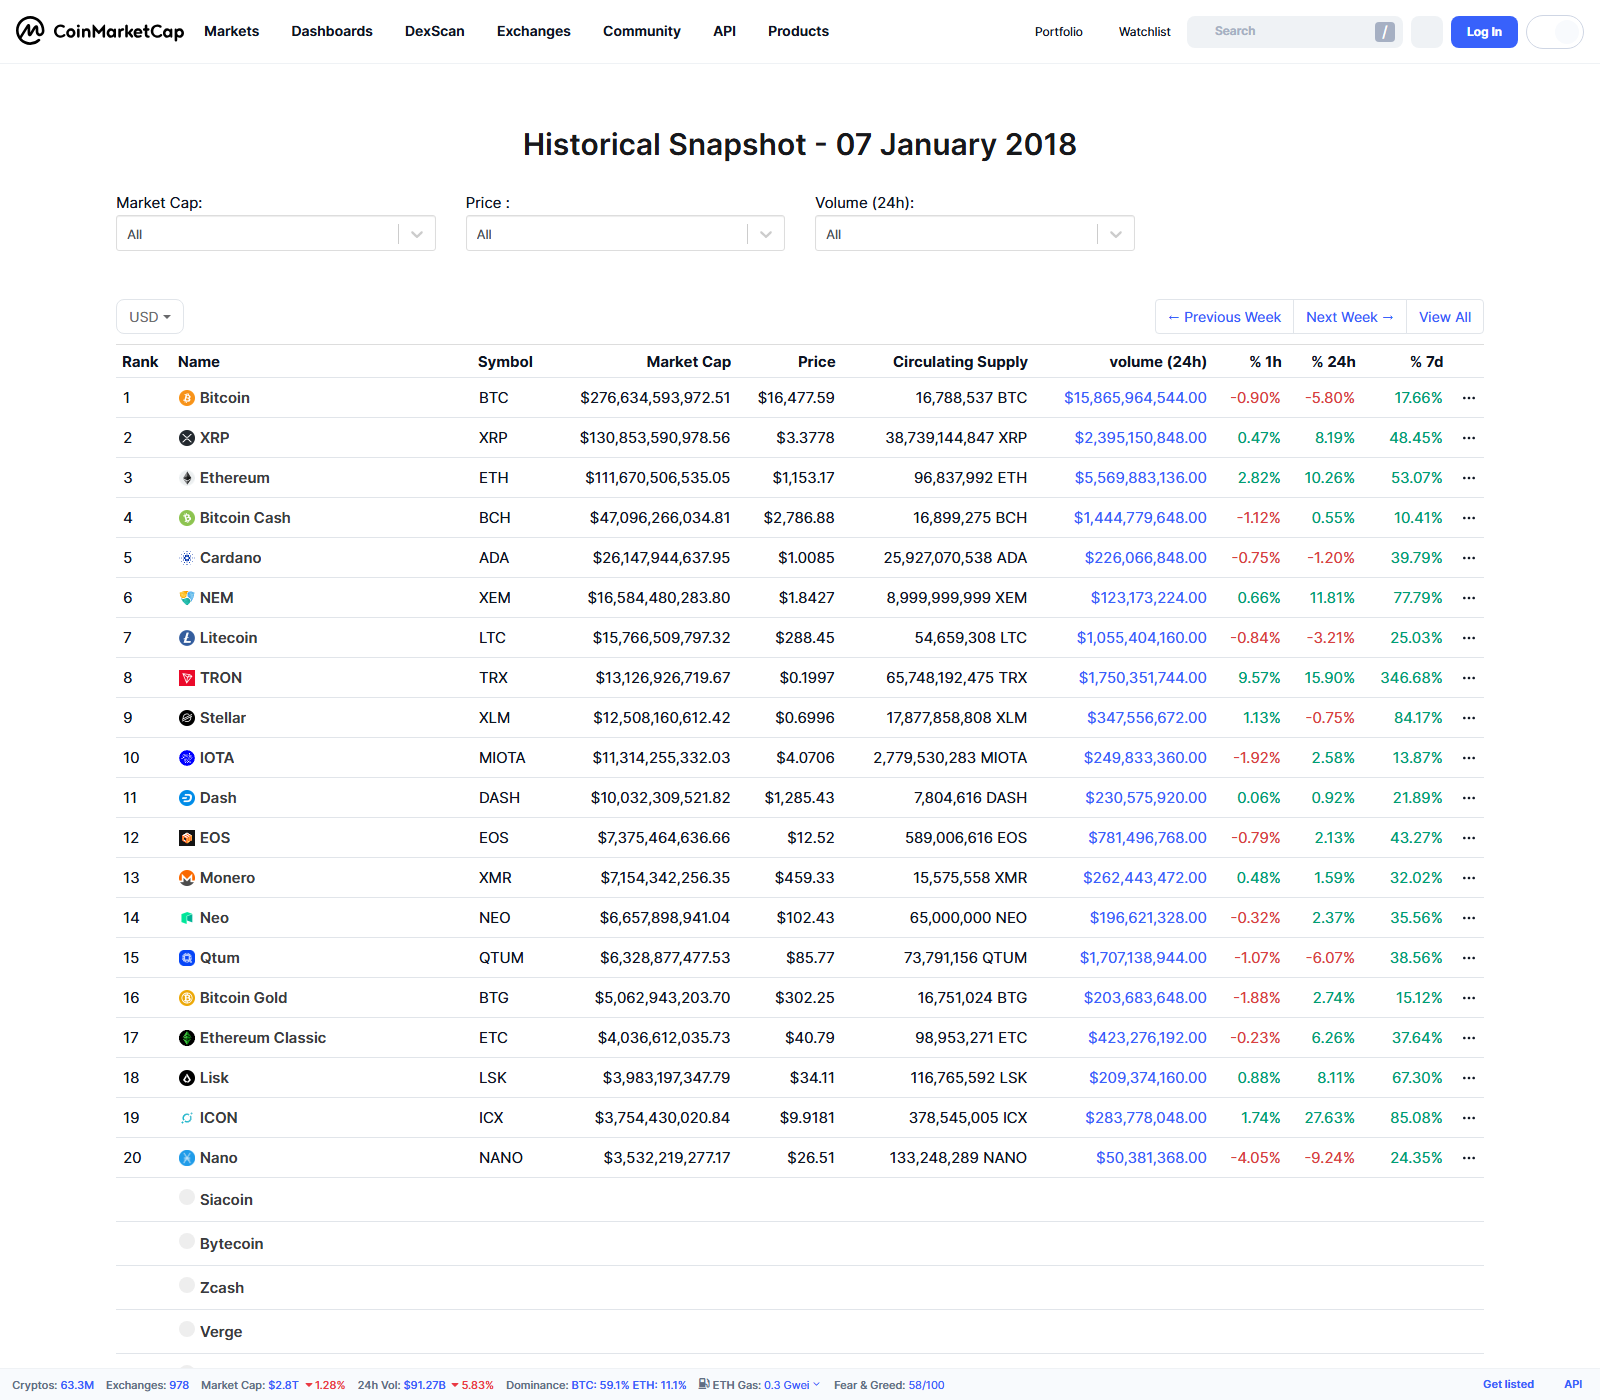
Bitcoin turned $1 into $5.18. Ether made $2.39 and TRON $1.67. Everything else lost money: XRP $0.55, Stellar $0.34, Cardano and Litecoin $0.25, Bitcoin Cash $0.14, NEM $0.05 and IOTA $0.01. That's a 392× gap between the best and the worst coin on the same day.
The buying method moved each coin far less. Spreading the dollar over 52 weekly buys instead of one helped every 2018 coin, because January 2018 came just after the top: bitcoin's highest close of that cycle was $19,103 on 16 December 2017. Weekly buying multiplied the result by 2.4× (bitcoin) to 9.2× (Cardano). That is a lot, and it still didn't rescue a bad pick: IOTA bought weekly is worth $0.07 per $1. Even the whole basket bought weekly ($4.04) ended below bitcoin bought in one go ($5.18).
Eight Januaries: bitcoin was hard to beat
The 2018 result isn't a one-off. In six of the eight years, the top-10 basket did worse than bitcoin bought on the same day. The two exceptions came from one coin: BNB, Binance's own token, turned $1 into $54.74 from January 2020 and $18.65 from January 2021. Without BNB, the 2020 basket made $6.13 (bitcoin $11.36) and the 2021 basket $1.92 (bitcoin $2.53).
BNB beat bitcoin in four of the six Januaries it was in the top 10 (2020, 2021, 2024, 2025). A few others did it in some years: ether from 2020 and 2021, XRP from 2021 and 2024, TRON from 2023, 2024 and 2025. From January 2018, 2019 and 2022, no top-10 coin did.
The worst case is 2022. Terra (LUNA) was in the January top 10. A lump sum in it is worth practically nothing: about $0.0000006 of each dollar. Weekly buying is worth $0.28 per dollar, and not because it timed anything: its 19 buys before the collapse in May 2022 are worth nothing too, but the 31 after it bought the renamed coin (LUNC) for a fraction of a cent, and two weeks with no trading stayed in cash.
Weekly buying beat the lump sum for the whole basket in three of the eight years (2018, 2022 and 2025) and lost in the other five. When it lost, the coins cost more during the buying year than they had in January.
Bitcoin and ether: the lump sum usually won
For the second test we took every single day since 17 August 2017, the first day in Binance's archive, as a start date, and compared two ways of investing the same $1 over 1, 3 and 5 years: all of it on day one, or an equal slice every week of the period.
| Coin | Period | Start dates | Lump sum won | Typical result: lump sum | Typical result: weekly | Worst: lump sum | Worst: weekly |
|---|---|---|---|---|---|---|---|
| Bitcoin | 1 year | 2,968 | 62% | $1.39 | $1.24 | $0.17 | $0.43 |
| Bitcoin | 3 years | 2,240 | 70% | $2.64 | $1.98 | $0.91 | $0.90 |
| Bitcoin | 5 years | 1,512 | 85% | $5.22 | $2.67 | $0.90 | $1.40 |
| Ether | 1 year | 2,968 | 59% | $1.10 | $1.10 | $0.08 | $0.24 |
| Ether | 3 years | 2,240 | 65% | $2.54 | $1.77 | $0.49 | $0.62 |
| Ether | 5 years | 1,512 | 73% | $7.87 | $3.80 | $0.57 | $0.69 |
"Typical" is the median across all start dates. Values are what $1 became.
The reason: from most start dates both coins ended well above where they began (a typical 3-year bitcoin result is $2.64 per dollar), so money invested earlier had more time to grow. The longer the period, the more often the lump sum won.
Where weekly buying earns its keep
DCA's case isn't the average, it's the bad start. Bitcoin bought in one go on 16 December 2017 was worth $0.17 per dollar a year later; spread over that year it was worth $0.43. Ether bought on 14 January 2018, a day after its highest close of that cycle ($1,388), was worth $0.08 a year later; spread over that year, $0.39.
Over one year, weekly buying also lost money on fewer start dates: 34% against 36% for bitcoin, and 38% against 46% for ether. Over three years the picture flips for bitcoin: weekly buying ended below $1 on 6% of start dates, the lump sum on about 0.5% (12 of 2,240). The money that arrives late in a long period is exposed to whatever happens at the end.
Why most DCA backtests look better than this
Exchange APIs list the coins that trade today, and the free tiers of CoinGecko and CoinPaprika we checked give one year of history. A backtest built on them can't buy January 2018's top 10, because some of those coins are gone. Binance's archive keeps delisted pairs, so we could follow each coin to the end: NEM (delisted June 2024), Monero (February 2024) and Bitcoin SV (April 2019) are cashed out at their last Binance price.
We expected the delisted coins to be the big distortion. They weren't: leaving NEM out lifts the 2018 basket only from $1.08 to $1.20. The damage came from coins that are still listed today, like IOTA and Bitcoin Cash. Coins that Binance never listed at all are outside this test. For what happened to the rest of the top 100, see Dead coins.
See it in TabChart
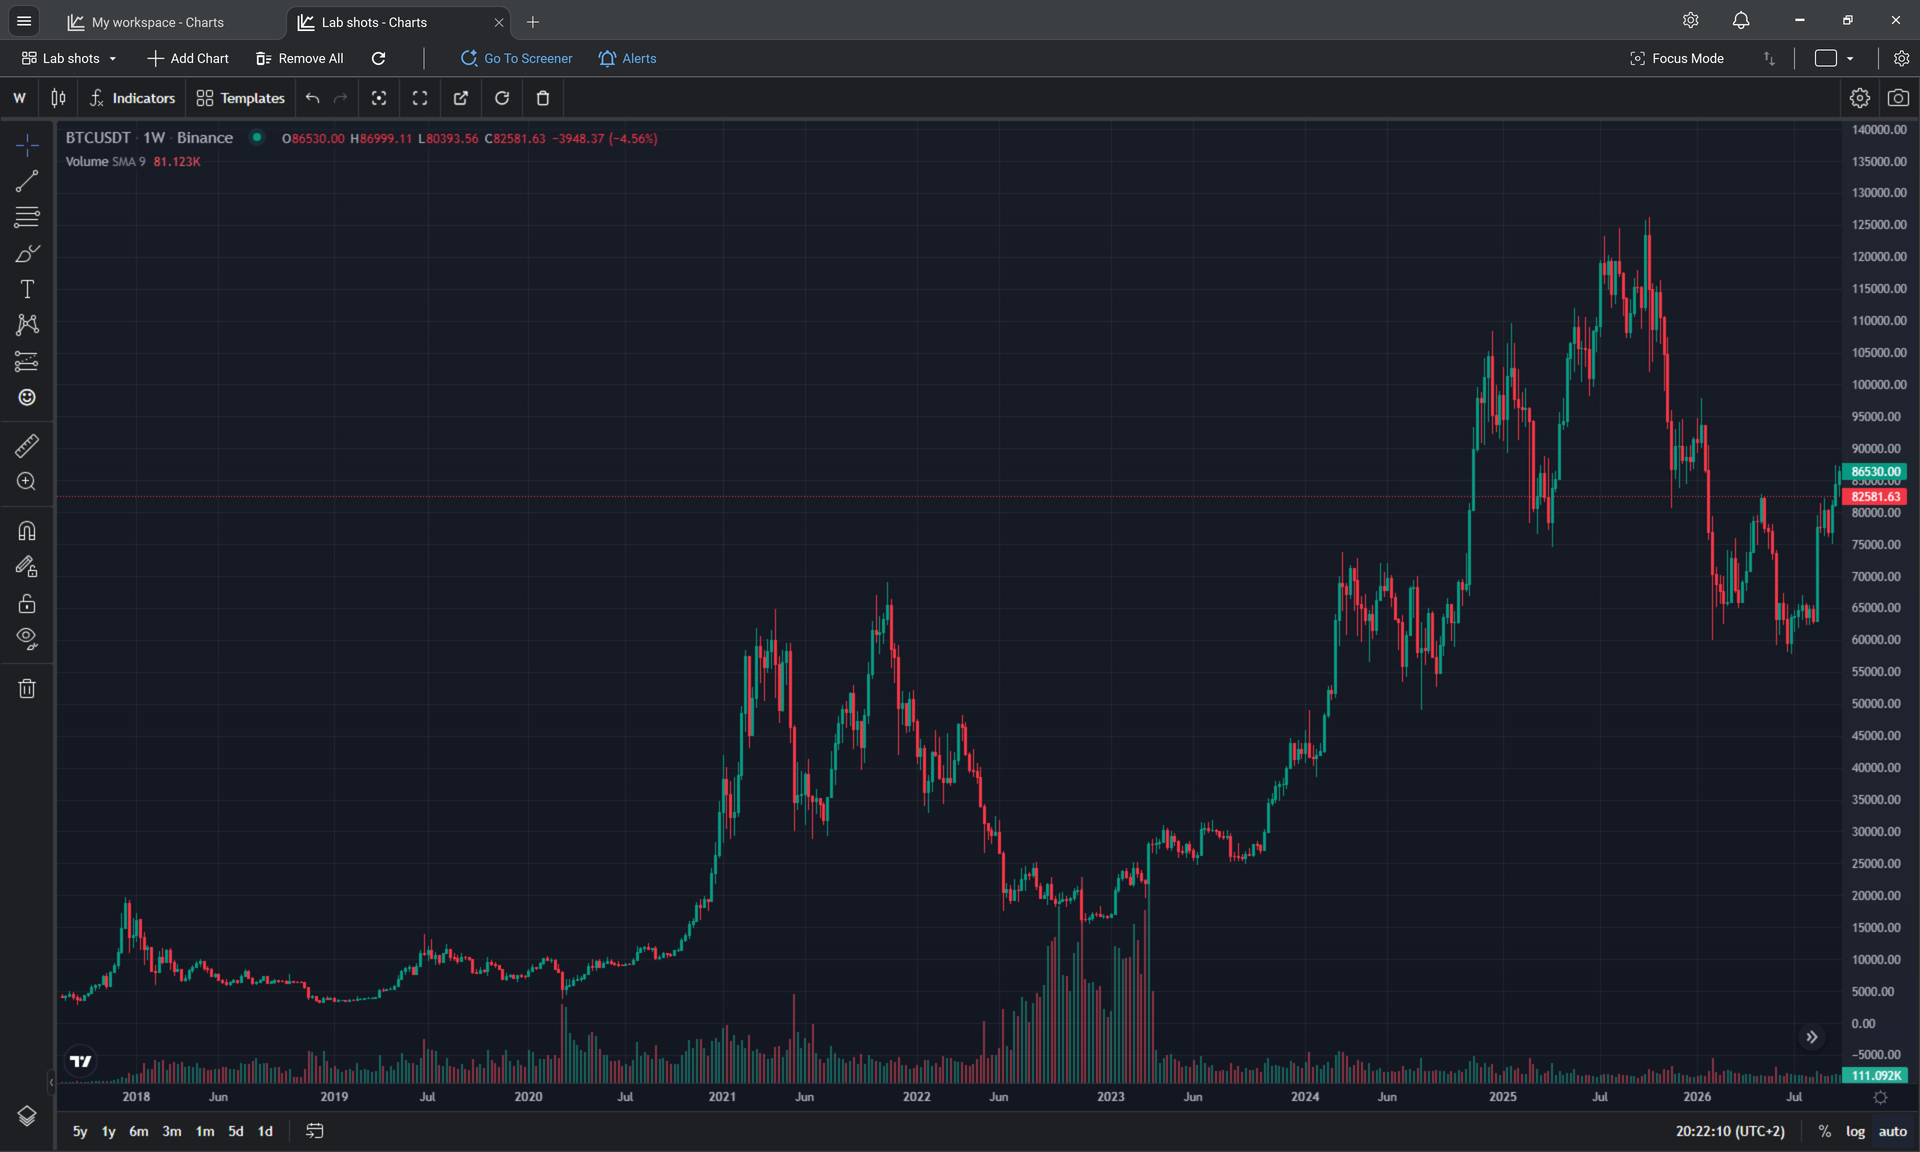
TabChart is a free Windows app for live crypto charts from Binance and six other exchanges, with no account. Open BTCUSDT on a weekly timeframe to see the whole period above. To work out your own average cost, try the DCA calculator: it shows why your average price paid sits below the average of the prices.
This is a backtest of what happened, not a forecast or advice. Past returns don't tell you future ones.
How we tested
| When | Backtest run on 8 and 9 October 2026, on prices up to the close of 30 September 2026 |
| Prices | Binance's public data archive (data.binance.vision), daily closes in USDT (a coin without a USDT pair through its BTC pair times BTCUSDT; LUNC through LUNCBUSD); 3,357 files, each checked against Binance's published SHA-256 checksum. The archive keeps delisted pairs |
| Coin lists | CoinMarketCap's historical snapshot for the first week of each January, 2018 to 2025: the first 10 coins, skipping stablecoins and wrapped tokens |
| Lump sum | $1 at the snapshot day's close, held to 30 September 2026 |
| Weekly buys (top 10) | $1/52 every 7 days for 52 weeks, then held to 30 September 2026 |
| Weekly buys (BTC, ETH) | Every start day from 17 August 2017; the same $1 split over every week of a 1, 3 or 5-year period (52, 156 or 260 buys), valued at its end |
| Renames and forks | One coin across its Binance symbols (BCC → BCHABC → BCH, LUNA → LUNC, MATIC → POL, EOS → A). Bitcoin Cash holders got 1 BSV per BCH at the November 2018 fork, as Binance credited it |
| Delisted | Cashed out at the last Binance close |
| Left out | A coin not on Binance within 90 days of the snapshot (Bitcoin SV in 2020 and 2021). NEM in 2018 starts on its first Binance day, 20 March 2018, compared with bitcoin from the same day |
| Not included | Trading fees (0.1% on Binance spot, the same for both methods), taxes, staking rewards, the new-LUNA airdrop of May 2022, coins Binance never listed |
| Price check | Binance's start prices against CoinMarketCap's snapshots: within 2.7% from 2019, mostly under 0.3% since 2021. In January 2018 CoinMarketCap's average still included Korean exchanges' premium (it dropped Bithumb, Coinone and Korbit the next day), so XRP looked 24% dearer there (Binance's price was 19% lower). We use the price you could pay on Binance |
Download the data: cohorts.csv (every coin, every January) · every start date, both methods: bitcoin over 1, 3 and 5 years, ether over 1, 3 and 5 years · the CSV behind each chart : t1-2018-top10.csv, t1-btc-3y-windows.csv.
FAQ
Is DCA better than a lump sum? For bitcoin and ether since 2017, usually not: a lump sum came out ahead on 59% to 85% of start dates, depending on the coin and the period. Weekly buying did better when the start date was close to a high, and over one year it narrowed the worst outcomes.
Does DCA work for crypto? It lowers the price you pay on average compared with the average price, and it softened the worst starts in our test (bitcoin bought at the December 2017 high: $0.43 instead of $0.17 after a year). It didn't save a coin that collapsed: IOTA bought weekly from January 2018 is worth $0.07 per dollar.
What happened to the top 10 cryptocurrencies of 2018? Bitcoin, ether and TRON are worth more than in January 2018; XRP, Stellar, Cardano, Litecoin, Bitcoin Cash, NEM and IOTA are worth less. NEM was delisted from Binance in June 2024.
Did any top-10 coin beat bitcoin? In single years, yes: BNB from 2020, 2021, 2024 and 2025, ether from 2020 and 2021, XRP from 2021 and 2024, TRON from 2023 to 2025. No top-10 coin beat it from January 2018, 2019 or 2022.
Does the day of the week matter for DCA? Hardly. We tested that too: the best day to buy bitcoin.