Real-time crypto charts on Windows
that are actually real-time
WebSocket-only architecture. Zero polling. Under a millisecond of processing latency between tick and chart. No third-party data aggregator sitting between you and the exchange.
"Real-time" is one of the most abused words in trading software
Most free crypto charts that claim to be real-time aren't. They poll the exchange's REST API every few seconds, render a new candle when the timer fires, and call it live. It looks live, so nobody complains. But during a volatile move, you can watch the price on the exchange tick three times before your "real-time" chart catches up.
Paid tools tend to do better, but a lot of them stream through an aggregation service - a middleman that adds its own caching, its own rate limiting, and occasionally its own bugs. Better than polling; still not the real exchange feed.
TabChart opens a WebSocket straight to the exchange
When you pick an exchange, TabChart opens a WebSocket connection directly to that exchange's public streaming API. Trade ticks, ticker updates, and kline (candle) updates arrive pushed - the exchange tells the app when something changed, not the other way round. No timer, no polling, no "refresh rate."
Incoming messages are parsed and dispatched to the chart under a millisecond. That's the processing latency you can measure on your own machine. The network latency between you and the exchange is whatever your connection gives you - usually 30–150 ms - and there's nothing any tool can do to improve that without co-location.
What matters is that TabChart doesn't add to that latency. No aggregator hop, no server-side caching layer, no throttling.
Where real-time actually changes what you see
Breakouts
The wick that takes out a level is often the single most important candle of the day. Polling charts miss it or display it seconds late. WebSocket charts print it live.
Volume spikes
Trade-tick volume updates arrive the moment the exchange matches orders. The volume bar grows in real time, not in five-second chunks.
Screener scanning
The same feed powers the market screener. Pairs resort themselves as ticks arrive, not on a refresh timer. During volatile moves, leader-board movement is visible as it happens.
Multi-chart awareness
Every chart in a workspace updates independently from its own WebSocket stream - whether you're running two, ten, or more. When BTC moves first and alts follow, you see the relationship live across the whole workspace.
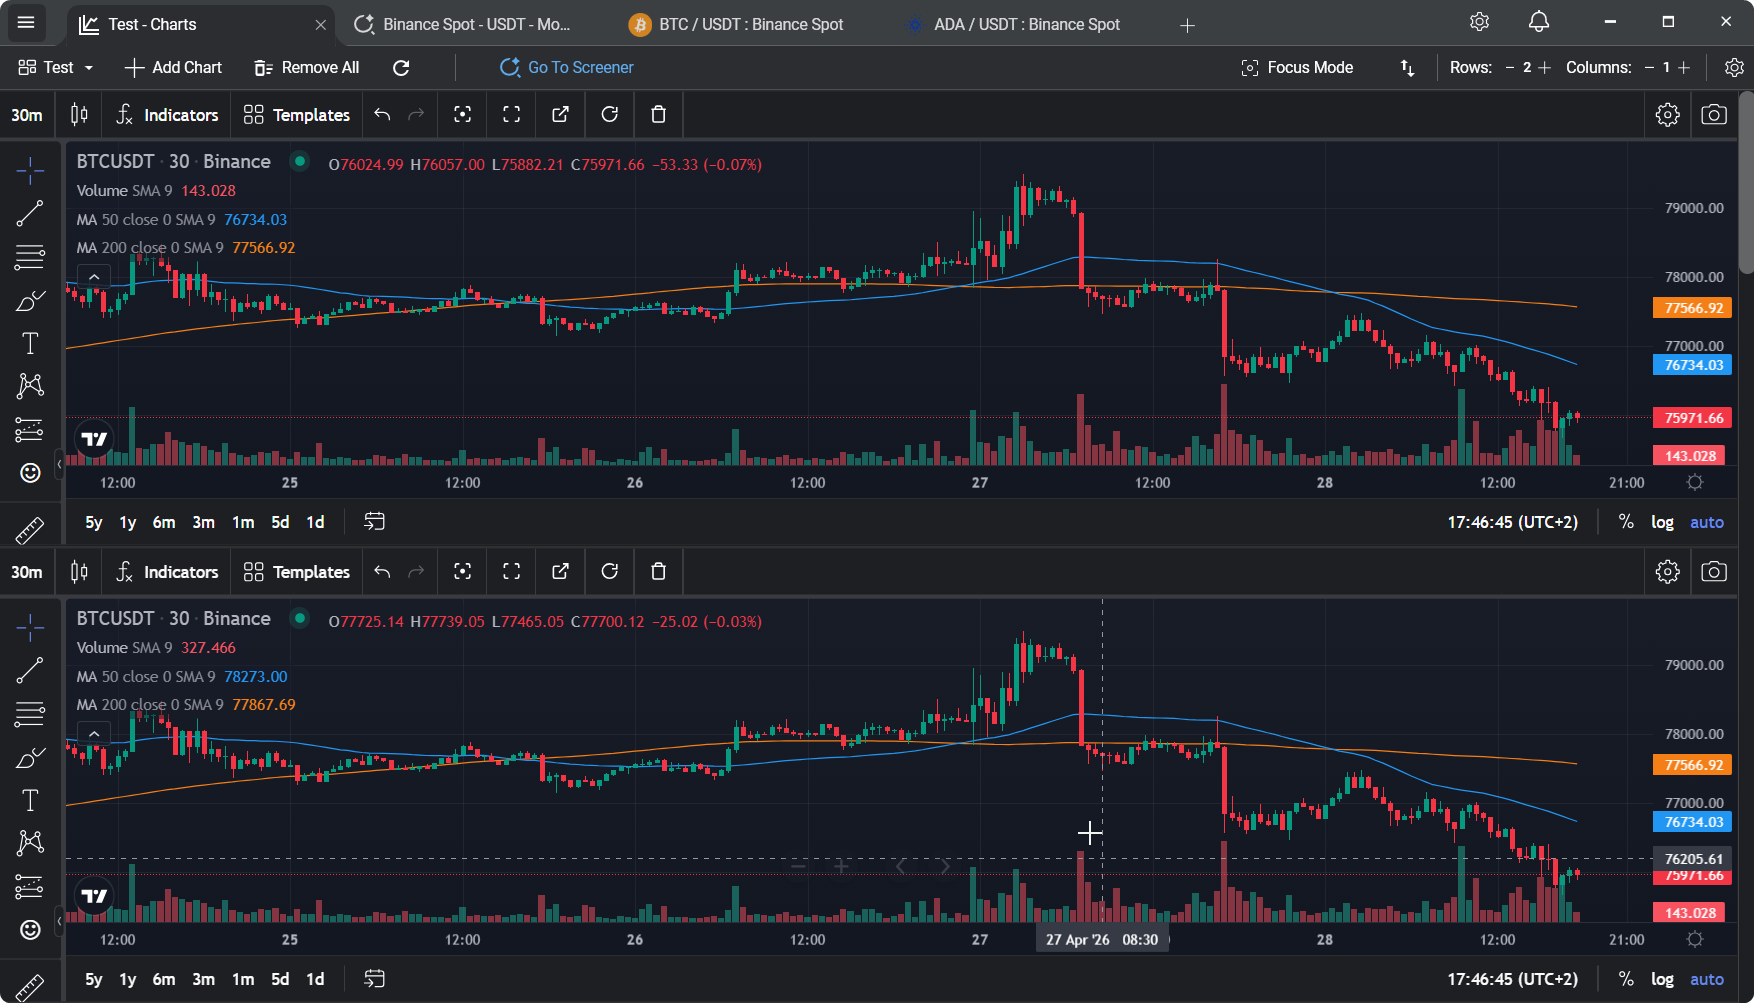
Watch a candle form in real time
The 1-minute chart below updates tick by tick as the exchange streams trades. No polling - the candle body grows as soon as a fill lands.
The technical specifics
- Pure WebSocket architecture. Zero polling for market data. Every price update is pushed from the exchange.
- <1 ms processing latency. The time from message arrival to chart update is sub-millisecond on modern hardware.
- Direct exchange connections. No proxy, no aggregator, no middle server. Your machine talks to the exchange's public API.
- No API keys needed. Public market data streams don't require credentials. Nothing sensitive is stored.
- Auto-reconnect on disconnect. Dropped WebSockets reconnect silently. Brief gaps are filled with a one-shot REST backfill so the chart stays consistent.
- Works across 1m to 1D timeframes. Streams update candles at every timeframe you have open simultaneously.
- Seven exchanges, independent feeds. Each exchange runs on its own connection; one laggy feed doesn't affect the others.
Questions worth answering honestly
"Will this make me a better trader?"
For most strategies - swing trading, position trading, trend following - the difference between polling and WebSocket is imperceptible. Where it matters: scalping, breakout trading, and any strategy where catching the exact moment matters. For those, yes; for others, it's a nice-to-have.
"Is sub-millisecond actually meaningful?"
It's meaningful as an upper bound on app-side overhead. Your network RTT to the exchange dominates everything; TabChart just doesn't add to it. The alternative is tools that add 1–10 seconds of aggregator delay on top of that network latency - and that is noticeable.
"Do I need a fast internet connection?"
Not particularly. WebSocket is bandwidth-light - a typical market stream for one pair is a few KB/s. Seven live charts across seven exchanges barely registers on a household connection.
"What happens if an exchange's API is down?"
The charts for that exchange stop updating; an indicator shows the connection state. Other exchanges keep streaming independently. When the exchange recovers, reconnection is automatic and a REST backfill smooths over the gap.
Charts that don't lag behind the market
Download, connect, watch the candles actually move.
Download TabChart freeWindows 10/11 - free, no account needed